

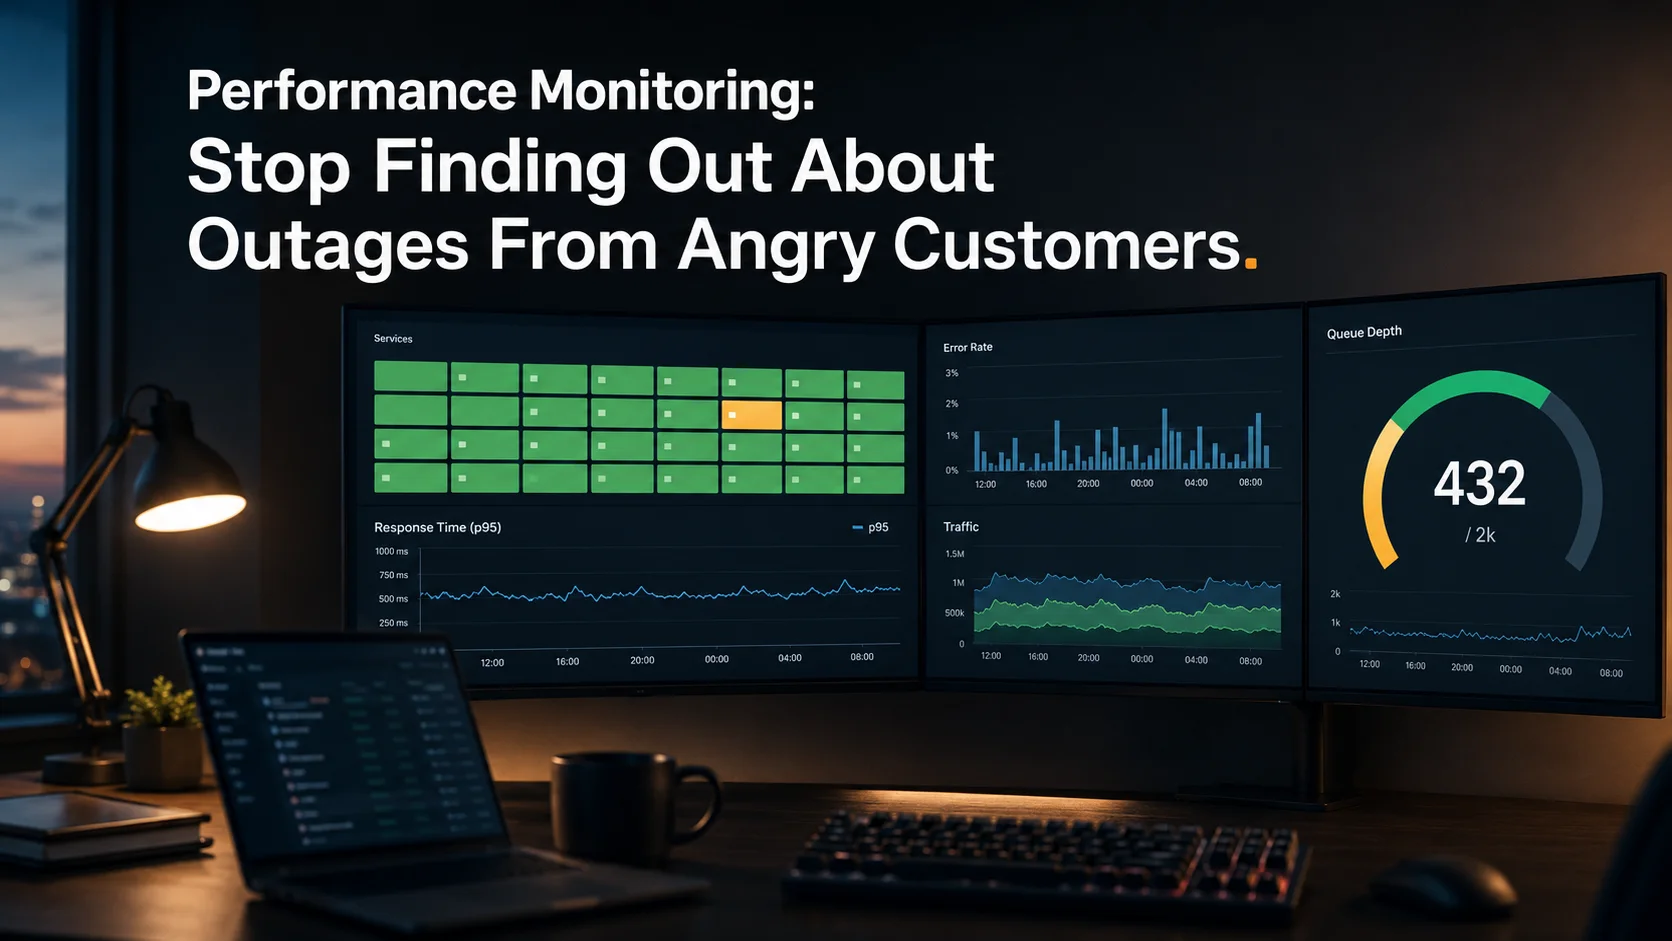
A founder messaged me at 7:42am: "Customers can't log in. Been like this for two hours. We just found out."
Two hours of broken authentication. Three angry support tickets. Zero alerts in their Slack.
The "monitoring" they were paying for was a basic uptime ping that only checked the homepage. Login was a separate flow on a separate subdomain. The check was green the entire time. The product was on fire the entire time.
That's the trap. You don't have monitoring just because you have a tool with "monitoring" in the name. You have monitoring when something breaks at 3am and the right human gets paged before any customer notices.
Here's how to set that up properly in 2026.
What Performance Monitoring Actually Has To Cover
Most teams treat monitoring like a single product. It isn't. It's four overlapping jobs:
→ Error tracking. Code-level exceptions with full stack trace, the request that triggered them, and which user was affected. Without this, you're guessing.
→ Uptime checks. External pings from outside your network, hitting real user flows — not just the homepage. Login, checkout, the API endpoint your mobile app uses. The stuff that matters.
→ Application performance. Response times, slow queries, queue backlogs, scheduled jobs that didn't run. The signals that say "something's degrading before it dies."
→ Infrastructure metrics. CPU, memory, disk, network. Cheap to capture, expensive to miss.
If you're only running one of those four — that's the leaky part of your bucket. The customer who complained at 7:42am hit the gap between uptime and application monitoring. The site was up. The product was broken. Different problem, different signal.
The Stack That Actually Works in 2026
I've tried a lot of monitoring combinations. The one that consistently works for small-to-mid teams costs under $200/month and catches almost everything.
Sentry — for errors. Best-in-class error tracking. Free tier handles real apps. Catches both backend exceptions and frontend JavaScript errors. Tells you which user, which release, which line of code.
Laravel Nightwatch — for Laravel apps. Built by the Laravel team, knows your framework natively. Eloquent queries, queue jobs, schedulers — all in Laravel terms, no config gymnastics. If you're not on Laravel, Datadog or New Relic do the same job for any stack.
Grafana + Prometheus — for infrastructure. Open source. Self-hosted on the same cloud you're running. CPU, memory, disk, network metrics with alerting. Heavy lift to set up the first time. Worth every hour after.
An external uptime monitor — UptimeRobot, BetterStack, or Pingdom. Pings from outside your network. Hits real endpoints, not just /. The check that catches "the firewall ate our traffic" because Sentry can't.
A queue and scheduler health check. This one is sneaky. Most teams forget that a queue worker dying silently or a cron job not running is invisible to APM. You need to alert when expected jobs don't happen. Laravel Nightwatch does this. So does a custom heartbeat endpoint.
That's the kit. Five tools, well-configured, talking to the right Slack channel.
Alert Less. Alert Better.
The most common monitoring failure I see: too many alerts.
When everything pages, nothing pages. The on-call dev tunes them out. The real one comes in at 4am and gets ignored.
The rule: alerts should mean a real human needs to look right now. Everything else goes to a digest.
What deserves a real-time alert:
- Site or critical endpoint is down (uptime fails)
- Error rate spikes 3x baseline in a 5-minute window
- p95 response time over your defined SLO
- Database connection pool exhaustion
- Queue backlog past a defined threshold (e.g., 1000 jobs)
- SSL certificate expiring in under 7 days
- Disk usage above 85%
What does not deserve a real-time alert:
- A single 500 error
- A slow query that's "always been kind of slow"
- CPU spiking once for 30 seconds
- Daily report jobs taking 10% longer than usual
- Any informational metric
Daily digest those. Or weekly review them. Don't wake people up for them.
We covered the on-call communication side — what to say to customers when things go wrong publicly: How to Communicate to Customers During a DDoS Attack.
The Metrics That Actually Predict Incidents
Most teams watch the wrong numbers.
CPU at 95% looks scary, but a stable 95% with low response times is fine. CPU spiking from 30% to 70% over a week is the actual problem — and easy to miss without trend analysis.
Here's what I actually watch as leading indicators of "something's about to break":
p95 response time trend. Average response times lie because they hide tail latency. p95 tells you what 5% of your users are actually experiencing. If p95 climbs steadily over two weeks, your DB is heading for a wall.
Slow query count. A query that took 200ms last month and 800ms this month with the same data — that's an index drift or a table that grew. Catch it before it becomes a 30-second timeout.
Queue depth and processing time. A queue that's slowly building means your workers can't keep up. Either traffic grew or jobs got slower. Both matter.
Memory growth on long-running processes. Memory leaks don't crash you immediately. They crash you on Saturday night three weeks from now.
Database connection count. Trending up = your code's leaving connections open. Will hit the pool limit on a busy day. Always.
Error rate by route. A specific endpoint quietly throwing 1% errors is invisible to overall metrics. Break errors down by route and the truth comes out.
I tell clients to set up a weekly 30-minute "metrics review" where someone actually looks at trends. The incidents you prevent in that 30 minutes pay for the entire monitoring stack.
Real-Data Performance: It's Not About Your Laptop
Performance numbers from your dev machine are lies. Your laptop has SSDs, low latency to localhost, no network jitter, and clean caches.
Production has cold starts, network hops, real database load, and users in places where the closest data centre is 2,400 km away.
The only performance numbers that matter come from real production users on real connections. That's why real user monitoring (RUM) belongs in your stack — Sentry has it built in, Datadog does it, Cloudflare gives it for free.
For users in regions far from your hosting region, the latency tax is brutal. We unpacked it here: Edge Computing for Web Apps — Why Latency Matters in the GCC.
After The Incident: Postmortems That Aren't Theatre
Every real incident gets a short, blameless postmortem within 48 hours. Not a 6-page document. A clear note covering:
- What happened (timeline, in user-impact terms)
- Why it happened (root cause, not just symptom)
- How we fixed it
- What we'll change to prevent recurrence
- What monitoring would have caught this earlier
The trap to avoid: turning postmortems into blame sessions. The engineer who pushed the bad deploy isn't the problem. The system that let a bad deploy reach production without catching it — that's the problem. Fix the system.
I've watched a 10-engineer team go from one major incident a month to one a quarter just by writing real postmortems and shipping the prevention items. The monitoring stack didn't change. The discipline did.
What "Proactive" Actually Means
Most agencies sell "proactive monitoring" and deliver "we'll tell you what the dashboard says." That's not proactive — that's reading.
Real proactive monitoring is:
- A weekly review of trends, not just alerts
- A monthly check on slow queries, with optimization PRs filed
- A quarterly capacity planning conversation: "at current growth, when do we run out of headroom?"
- Active recommendations to the dev team: this query needs an index, this endpoint needs caching, this server needs resizing
If your monitoring vendor or DevOps person isn't filing PRs and recommendations on a schedule, you're paying for graphs nobody acts on. Graphs aren't the deliverable. Fewer incidents are the deliverable.
For the broader infrastructure-decision angle: The Rise of Partial Pre-Rendering — Next.js 15 and the Future of Web Performance.
What to Do This Week
Pick the matching action:
If you don't have any monitoring: install Sentry today. Free tier. 15 minutes of work. You'll see your first real bug inside a week. Promise.
If you have basic uptime checks only: add real endpoint checks for login, checkout, and your top API route. Most uptime services support multi-step checks. If yours doesn't, switch to BetterStack or Pingdom.
If you have monitoring but no one's watching it: set up a 30-minute weekly metrics review on the calendar. Pick one engineer to own it. Watch trends, not just alerts.
If you have alert fatigue: spend one hour killing alerts. Anything that's fired more than five times in the last month without a real incident — turn it into a daily digest. The remaining alerts will get the attention they deserve.
The pattern across all four: start small, but actually start. Most monitoring failures aren't from picking the wrong tool. They're from picking the right tool and never tuning it.
The goal isn't fancy dashboards. The goal is finding out about problems before customers do. Pick the smallest piece you don't have yet, install it this week, and you'll already be ahead of most teams.